Your wells are running. But are they producing at their maximum safe capability? The difference between the two could represent 20-30% unrealized EUR over a well’s lifetime and may be hidden beneath decline curves that appear perfectly normal.
There are many possible limiters of a well’s production rates. The production volumes of oil and gas are ultimately governed by the physical properties of the reservoir rock. Each well’s production should reflect the reservoir’s true capability to deliver volumes, both daily and over its full productive life.
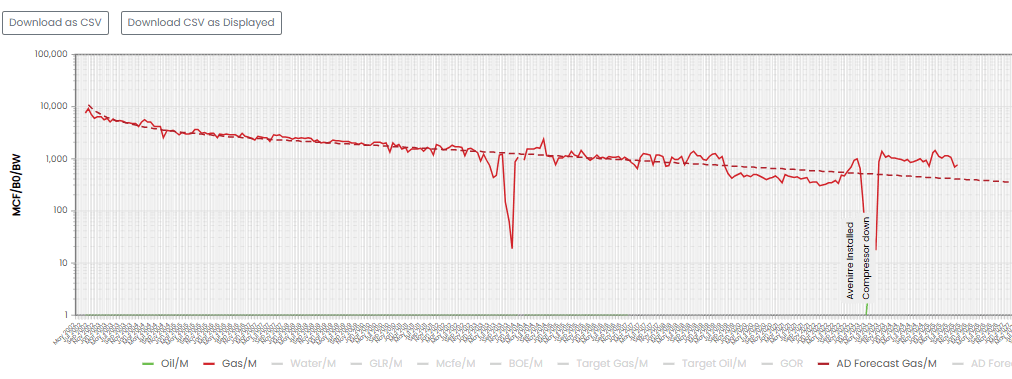
A critical question is to ask: How much SHOULD a well be producing? Decline curve analysis provides important insights, but only when interpreted carefully. A practiced and keen eye can learn to interpret decline curves so that you are seeing a true reservoir signal versus those wells that are sub-optimized. A curve may appear stable in the short term while masking significant underperformance. In the case of this example well below, production was consistently below reservoir capability until plunger lift was added in 2022.
These insights help to shape your real production targets. For wells operating below their theoretical optimum, it is important to begin asking “why” ideally during wellbore reviews, or sooner.

Leave a comment